Choose A Language
Infographics: Innovation maturity in funded projects

News – News & Updates

Infographics: Innovation maturity in funded projects

November 12, 2024

In the interest of transparency, we publish open data on all awards made in the Fund. Our latest open data set includes award data for Water Breakthrough Challenge 4 and can be found on Ofwat’s website. Our hope is this open data can inform and prompt discussion on the future of the Fund, and help us improve the Fund’s long-term impact for customers, society and the environment.

In a previous blog, ‘Partnerships across the water cycle: an analysis of awards in the Ofwat Innovation Fund’, we examined how our awards have been allocated across the different competitions up to Breakthrough 3 (Spring 2023).

In this post we, share several infographics looking at:

  • how the estimated maturity of innovation projects varies across each of the competitions; and
  • water company partnerships within the funded projects.

Notes:

  • This analysis uses additional final submission data from entrants to provide a static baseline data source.
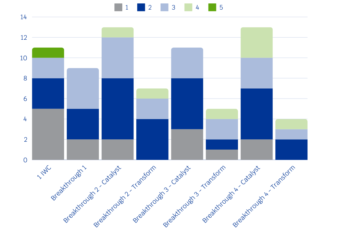
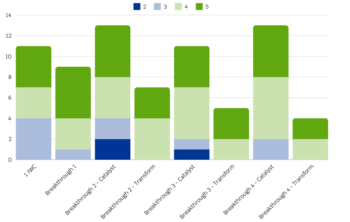
  • As part of the entry process, entrants were asked to provide a high-level expectation of their project’s Innovation Maturity Level (IML) both at the start and the end of their planned phases of work. IML is intended to give a high-level indication of the technological, commercial and operational readiness of the proposed innovation, over five levels:
    • 1 – Initial Research – Understanding the problem and exploring possible solutions.
    • 2 – Concept & feasibility – Developing or testing a concept, designing the solution, and testing feasibility of solutions.
    • 3 – Development & verification – Developing the preferred solution, verifying the design through demonstration in a real-world (or near real world) environment
    • 4 – Validation & optimisation – Scaling the solution for use (‘rollout’) or commercialisation
    • 5 – Deployment & post-launch – Implementing or rolling out the solution and assessing its impact.

Chart 1 shows the composition of projects within each competition based on expected start IML.

Bar chart showing composition of Ofwat Innovation Fund projects from each competition stream based on expected start innovation maturity level

Chart 2 shows the composition of projects within each competition based on expected end IML.

Bar chart showing composition of Ofwat Innovation Fund projects from each competition stream based on expected end innovation maturity level

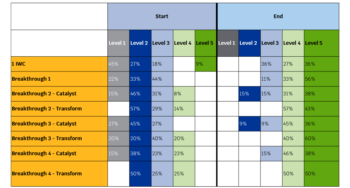
Table 2: the progression of IML between the proposed start and end IML

Table showing progression of IML between proposed start and end IML levels between the different Ofwat Innovation Fund competitions.

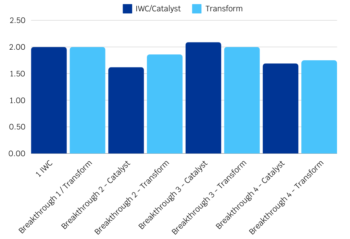
Chart 3 – average IML spread by stream

Bar chart showing the average IML spread by competition stream in shades of blue

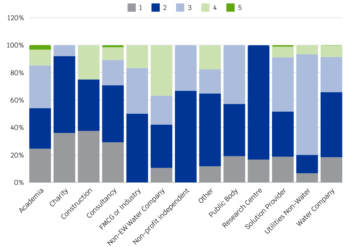
Chart 4:  Partner type by start IML – The “other” category contains unidentified partners at the time of entry into the Fund (which were to be put out to tender).

A 100% stacked bar chart showing the different types of partner organisations across the different competition streams of the Ofwat Innovation Fund in greys, blues and greens

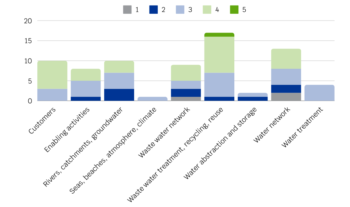
Chart 5: End IML by water cycle tag

Bar chart showing end IML by water tags across the water cycle